반응형
안녕하세요. 언제나휴일입니다.
이번에는 막대그래프를 그릴 때 사용하는 pyplot의 bar와 barh를 사용하는 실습을 할게요.
1. 시그니쳐
bar 함수에서는 x, height를 barh함수에서는 y, width 값을 필수로 전달합니다.
#막대그래프
#matplotlib.pyplot.bar(x,
#                                  height,
#                                  width=0.8,
#                                  bottom=None,
#                                  align='center',
#                                  data=None,
#                                  **kwargs)
# **kwargs: color, edgecolor,linewidth, tick_label, xerr, yerr, ecolor, capsize
2. 수직 막대그래프
import matplotlib.pyplot as plt

levels = ['a', 'b', 'c']
counts = [12, 23, 18]

plt.bar(levels, counts)
plt.xlabel("level")
plt.ylabel("count")
plt.title("count per level")
plt.show()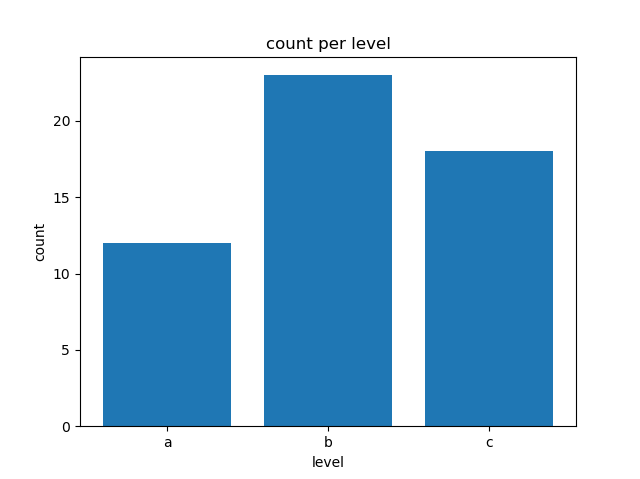
3. 수평 막대그래프
years = ['2018','2019','2020']
incomes = [3018, 3040, 3790]

plt.barh(years, incomes)
plt.xlabel("income")
plt.ylabel("year")
plt.title("income per year")
plt.show()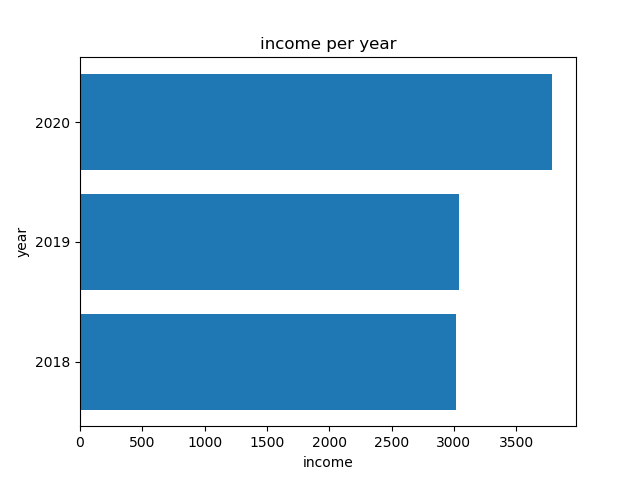
4. 막대 두께 조절
barh함수에서는 높이(height) 조절입니다.
plt.bar(levels, counts,width=0.4)
plt.xlabel("level")
plt.ylabel("count")
plt.title("bar width=4")
plt.show()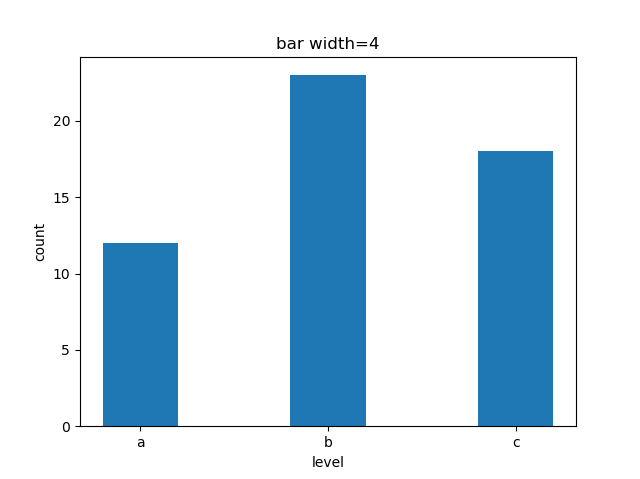
5. 막대그래프를 층으로 쌓기
labels=['a','b','c']
downs=[1,2,3]
tops=[3,4,2]
plt.bar(labels,downs)
plt.bar(labels,tops,bottom=downs)
plt.title("use bottom")
plt.show()
6. xticks 정렬 설정
디폴트는 'center' 이며 'edge'를 주면 시작 부분으로 정렬
plt.bar(levels, counts,align='edge')
plt.xlabel("levels")
plt.ylabel("count")
plt.title("align='edge'")
plt.show()
7. 막대 색 지정
colors=['red','green','blue']
levels = ['a', 'b', 'c']
counts = [12, 23, 18]

plt.bar(levels, counts,color=colors)
plt.xlabel("level")
plt.ylabel("count")
plt.title("set color")
plt.show()
8. 막대 경계 색 지정
edgecolors=['green','blue','red']
plt.bar(levels, counts,color=colors,edgecolor=edgecolors)
plt.xlabel("level")
plt.ylabel("count")
plt.title("set edgecolor")
plt.show()
9. 막대 경계 두께 지정
edgecolors=['green','blue','red']
plt.bar(levels, counts,color=colors,edgecolor=edgecolors,linewidth=3)
plt.xlabel("level")
plt.ylabel("count")
plt.title("set linewidth")
plt.show()
10. x data가 수 형식일 때 tick 지정
x data가 수 형식일 때는 tick을 지정하지 않으면 표시 값이 다릅니다.
nums=[1,2,3,4,5,6,7,8,9]
scores=[90,80,77,65,89,99,75,69,90]
plt.bar(nums,scores)
plt.title("not set tick_label")
plt.show()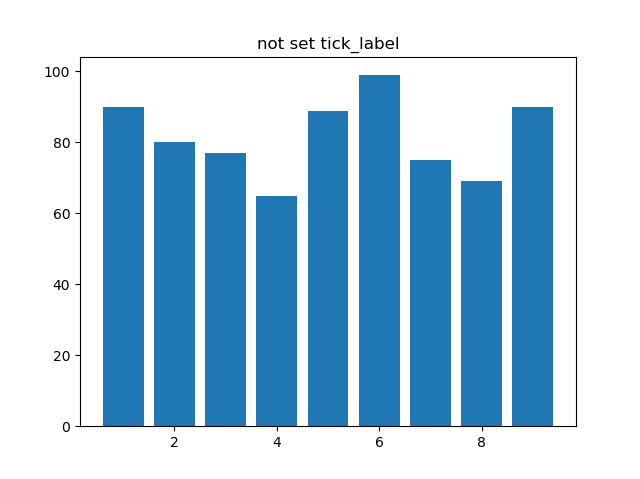
이 때 원하는 x data로 tick을 명시적으로 지정할 수 있어요.
nums_str=[]
for num in nums:
    nums_str.append(num)
plt.bar(nums,scores,tick_label=nums_str)
plt.title("set tick_label")
plt.show()
11. error 표시
수직 막대그래프에서는 yerr를 사용합니다.
errors = [2,4,3]
plt.bar(levels, counts,color=colors,yerr=errors)
plt.xlabel("level")
plt.ylabel("count")
plt.title("set yerr")
plt.show()

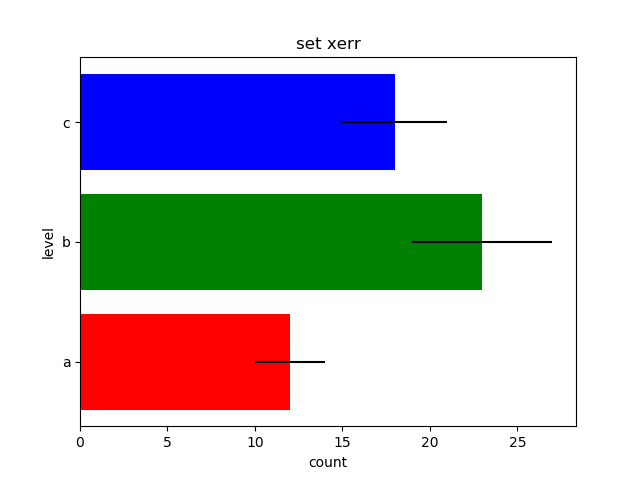
수평 막대그래프에서는 xerr를 사용합니다.
plt.barh(levels, counts,color=colors,xerr=errors)
plt.ylabel("level")
plt.xlabel("count")
plt.title("set xerr")
plt.show()
12. error 색 지정
ecolors=['blue','red','green']
plt.bar(levels, counts,color=colors,yerr=errors,ecolor=ecolors)
plt.xlabel("levels")
plt.ylabel("count")
plt.title("set ecolor")
plt.show()
13. error에 cap 설정
plt.bar(levels, counts,color=colors,yerr=errors,capsize=10)
plt.xlabel("levels")
plt.ylabel("count")
plt.title("set capsize")
plt.show()
14. 전체 코드
#막대그래프
#matplotlib.pyplot.bar(x,
#                                  height,
#                                  width=0.8,
#                                  bottom=None,
#                                  align='center',
#                                  data=None,
#                                  **kwargs)
# **kwargs: color, edgecolor,linewidth, tick_label, xerr, yerr, ecolor, capsize
import matplotlib.pyplot as plt

levels = ['a', 'b', 'c']
counts = [12, 23, 18]

plt.bar(levels, counts)
plt.xlabel("level")
plt.ylabel("count")
plt.title("count per level")
plt.show()


years = ['2018','2019','2020']
incomes = [3018, 3040, 3790]

plt.barh(years, incomes)
plt.xlabel("income")
plt.ylabel("year")
plt.title("income per year")
plt.show()

plt.bar(levels, counts,width=0.4)
plt.xlabel("level")
plt.ylabel("count")
plt.title("bar width=4")
plt.show()

labels=['a','b','c']
downs=[1,2,3]
tops=[3,4,2]
plt.bar(labels,downs)
plt.bar(labels,tops,bottom=downs)
plt.title("use bottom")
plt.show()


plt.bar(levels, counts,align='edge')
plt.xlabel("levels")
plt.ylabel("count")
plt.title("align='edge'")
plt.show()

colors=['red','green','blue']
levels = ['a', 'b', 'c']
counts = [12, 23, 18]

plt.bar(levels, counts,color=colors)
plt.xlabel("level")
plt.ylabel("count")
plt.title("set color")
plt.show()

edgecolors=['green','blue','red']
plt.bar(levels, counts,color=colors,edgecolor=edgecolors)
plt.xlabel("level")
plt.ylabel("count")
plt.title("set edgecolor")
plt.show()

edgecolors=['green','blue','red']
plt.bar(levels, counts,color=colors,edgecolor=edgecolors,linewidth=3)
plt.xlabel("level")
plt.ylabel("count")
plt.title("set linewidth")
plt.show()

nums=[1,2,3,4,5,6,7,8,9]
scores=[90,80,77,65,89,99,75,69,90]
plt.bar(nums,scores)
plt.title("not set tick_label")
plt.show()
nums_str=[]
for num in nums:
    nums_str.append(num)
plt.bar(nums,scores,tick_label=nums_str)
plt.title("set tick_label")
plt.show()

errors = [2,4,3]
plt.bar(levels, counts,color=colors,yerr=errors)
plt.xlabel("level")
plt.ylabel("count")
plt.title("set yerr")
plt.show()

plt.barh(levels, counts,color=colors,xerr=errors)
plt.ylabel("level")
plt.xlabel("count")
plt.title("set xerr")
plt.show()

ecolors=['blue','red','green']
plt.bar(levels, counts,color=colors,yerr=errors,ecolor=ecolors)
plt.xlabel("levels")
plt.ylabel("count")
plt.title("set ecolor")
plt.show()

plt.bar(levels, counts,color=colors,yerr=errors,capsize=10)
plt.xlabel("levels")
plt.ylabel("count")
plt.title("set capsize")
plt.show()
반응형
'Python > matplotlib' 카테고리의 다른 글
| [python matplotlib] pyplot 주석 달기 - annotate (0) | 2020.11.23 |
|---|---|
| [python matplotlib] pyplot 파이 챠트 - pie (0) | 2020.11.23 |
| [python matplotlib] pyplot.plot 호출 인자(입력 매개변수) (0) | 2020.11.20 |
| [python matplotlib] pyplot 색상 지정 (0) | 2020.11.20 |
| [python matplotlib] pyplot의 기본 기능 (0) | 2020.11.20 |